Causal Inference
Principal Stratification and Mediation
This post explores principal stratification and mediation analysis as tools for understanding causal effects, decomposing them into direct and indirect components. It covers scenarios like non-compliance, missing outcomes, and surrogate indices, highlighting the importance of assumptions such as no direct effects and no Defiers. Practical methods, including multiple imputation, regression, and matching, are discussed for estimating effects even when key quantities are unobserved. Real-world examples, like marketing lift studies and product funnels, illustrate the relevance of these techniques for addressing complex causal questions.

Interpretable and Validatable Uplift Modeling
In this note, we introduce a method for interpreting and validating the results of uplift modeling. We propose two novel strategies for controlling the Familywise Error Rate in this setting.

Modes of Inference in Randomized Experiments
Randomization provides the “reasoned basis for inference” in an experiment. Yet some approaches to analyzing experiments ignore the special structure of randomization. Simple, familiar approaches like regression models sometimes give wrong answers when applied to experiments. Approaches exploiting randomization deliver more reliable inferences than methods neglecting it. Randomization inference should be the first method we reach for when analyzing experiments.

Sensitivity Analysis for Matched Sets with One Treated Unit
Adjusting for observed factors does not elevate an observational study to the reliability of an experiment. P-values are not appropriate measures of the strength of evidence in an observational study. Instead, sensitivity analysis allows us to identify the magnitude of hidden biases that would be necessary to invalidate study conclusions. This leads to a strength-of-evidence metric appropriate for an observational study.

Sensitivity Analysis for Matched Pairs
Observational studies involve more uncertainty than randomized experiments. Sensitivity analysis offers an approach to quantifying this uncertainty.

Attributable Effects
In a previous post, we discussed why randomization provides a reasoned basis for inference in an experiment. Randomization not only quantifies the plausibility of a causal effect but also allows us to infer something about the size of that effect.

The Reasoned Basis for Inference in Experiments
In his 1935 book, “Design of Experiments”, Ronald Fisher described randomization as the “reasoned basis for inference” in an experiment. Why do we need a “basis” at all, let alone a reasoned one?
Tests with One-Sided Noncompliance
Introduction Tech companies spoil data scientists. It’s so easy for us to A/B test everything. We can alter many aspects of the product from a configuration UI. We have the sample size to get a good read in as little as a few days. We have the data infrastructure to analyze and report results quickly.
User Segmentation from Heterogeneous Treatment Effects
Imagine we are attempting to identify segments within an audience, perhaps so we can market to them more effectively through personalization. A common approach to doing so is to apply some kind of clustering algorithm (such as K-means) based on various user covariates. I have never been especially happy with this approach: the resulting clusters seem pretty arbitrary.
Heterogeneous Treatment Effect Estimation: Function Approximation
A simple approach to heterogeneous treatment effect estimation relies on a difference in approximations to the outcome function among the two treatment groups. In this post, I derive the conditions under which this approach works.
The Alternative to Causal Inference is Worse Causal Inference
Some of the most important questions data scientists investigate are causal questions. They’re also some of the hardest to answer! A well-designed A/B test often provides the cleanest answer, but when a test is infeasible, there are plenty of other causal inference techniques that may be useful. While not perfect, these techniques are much better than the alternative: ad hoc methods with no logical foundation.
Supervised Learning as Function Approximation
Supervised learning is perhaps the most central idea in Machine Learning. It is equally central to statistics where it is known as regression. Statistics formulates the problem in terms of identifying the distribution from which observations are drawn; Machine Learning in terms of finding a model that fits the data well.
Naive Comparisons Under Endogeneity
Recently I have been reading Causal Inference: The Mixtape by Scott Cunningham. One thing I think Cunningham explains very well is the role of endogeneity in confounding even simple comparisons. I don’t have a background in economics, so I had never really grokked the concepts of endogenous and exogenous factors, especially as it related to causal inference. In this post, I’m going to discuss a few examples that highlight why it’s such an important distinction.
Violations of the Stable Unit Treatment Value Assumption
We have previously mentioned the Stable Unit Treatment Value Assumption, or SUTVA, a complicated-sounding term that is one of the most important assumptions underlying A/B testing (and Causal Inference in general). In this post, we talk a little more about it and why it is so important.
Contingency Tables Part IV: The Score Test
The score test can be used to calculate p-values and confidence intervals for A/B tests. The score test considers the slope of the likelihood function at the parameter value associated with the null hypothesis.
Sprinkle some Maximum Likelihood Estimation on that Contingency Table!
Maximum Likelihood Estimation provides consistent estimators, and can be efficiently computed under many null hypotheses of practical interest.
Contingency Tables Part II: The Binomial Distribution
In our last post, we introduced the potential outcomes framework as the foundational framework for causal inference. In the potential outcomes framework, each unit (e.g. each person) is represented by a pair of outcomes, corresponding to the result of the experience provided to them (treatment or control, A or B, etc.)
Contingency Tables Part I: The Potential Outcomes Framework
“Why can’t I take the results of an A/B test at face value? Who are you, the statistics mafia? I don’t need a PhD in statistics to know that one number is greater than another.” If this sounds familiar, it is helpful to remember that we do an A/B test to learn about different potential outcomes. Comparing potential outcomes is essential for smart decision making, and this framework is the cornerstone of causal inference.
A/B Testing
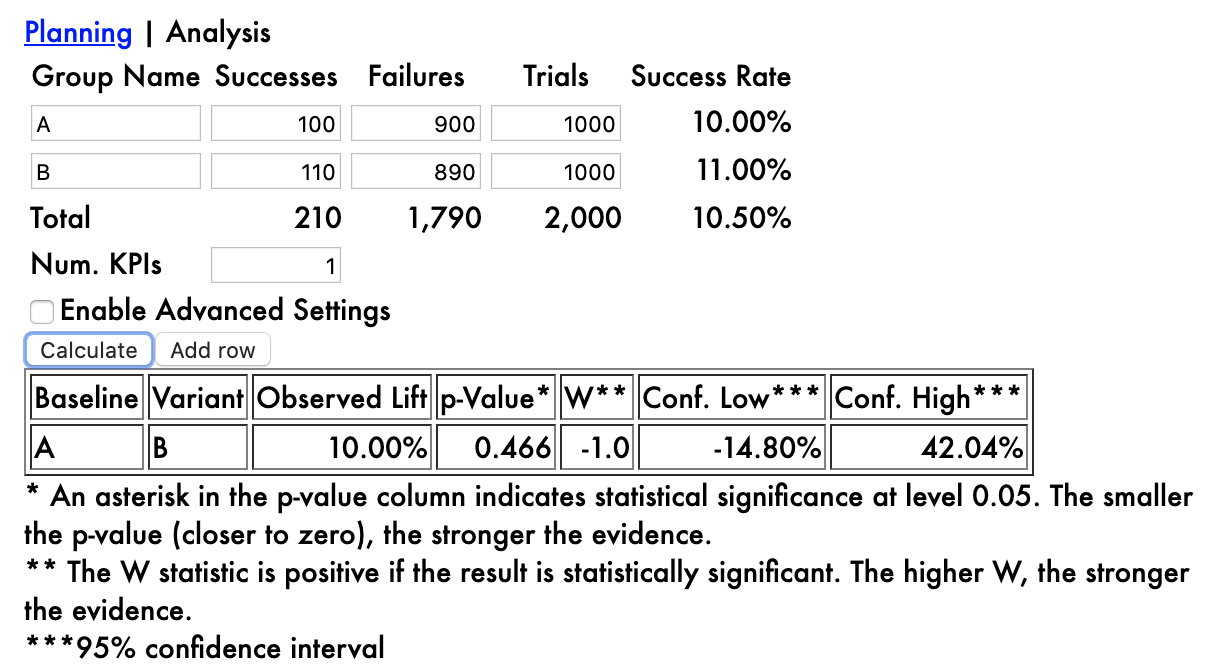
Calculators for planning and analyzing A/B tests
A/B Testing Best Practices
When I started this blog, my primary objective was less about teaching others A/B testing and more about clarifying my own thoughts on A/B testing. I had been running A/B tests for about a year, and I was starting to feel uncomfortable with some of the standard methodologies. It’s pretty common to use Student’s t-test to analyze A/B tests for example. One of the assumptions underlying that test is that the distributions are Gaussian. “What about A/B testing is Gaussian?”, I wondered. I knew there was a big difference between one-sided and two-sided tests, but I didn’t feel confident in my ability to choose the right one. And the multiple comparisons problem seemed to rear its ugly head at every turn: what was the best way to handle this?
Optimal Experiment Design
We can plan sample sizes to control the width of confidence intervals.

Three Goals of Statistics: Description, Prediction, and Prescription
The great successes of Machine Learning in recent years are based on our ability to extrapolate and predict based on data. The next big step is learning and leveraging the relationship between cause and effect to prescribe what action to take.

Confidence Intervals
Statistical analysis is not complete without an estimate of residual uncertainty.

Statistical Power
Power considerations drive the sample sizes needed for a successful experiment.

Counterfactuals and Causal Reasoning
What does ‘Why?’ mean anyway?

Fisher's Exact Test
Simulation-based inference sits on a rigorous foundation.

A/B Testing, Part 2: Statistical Significance
Results can’t always be taken at face value.

A/B Testing, Part 1: Random Segmentation
Random segmentation is the gold standard of Causal Inference.